
Good observation starts with a good site
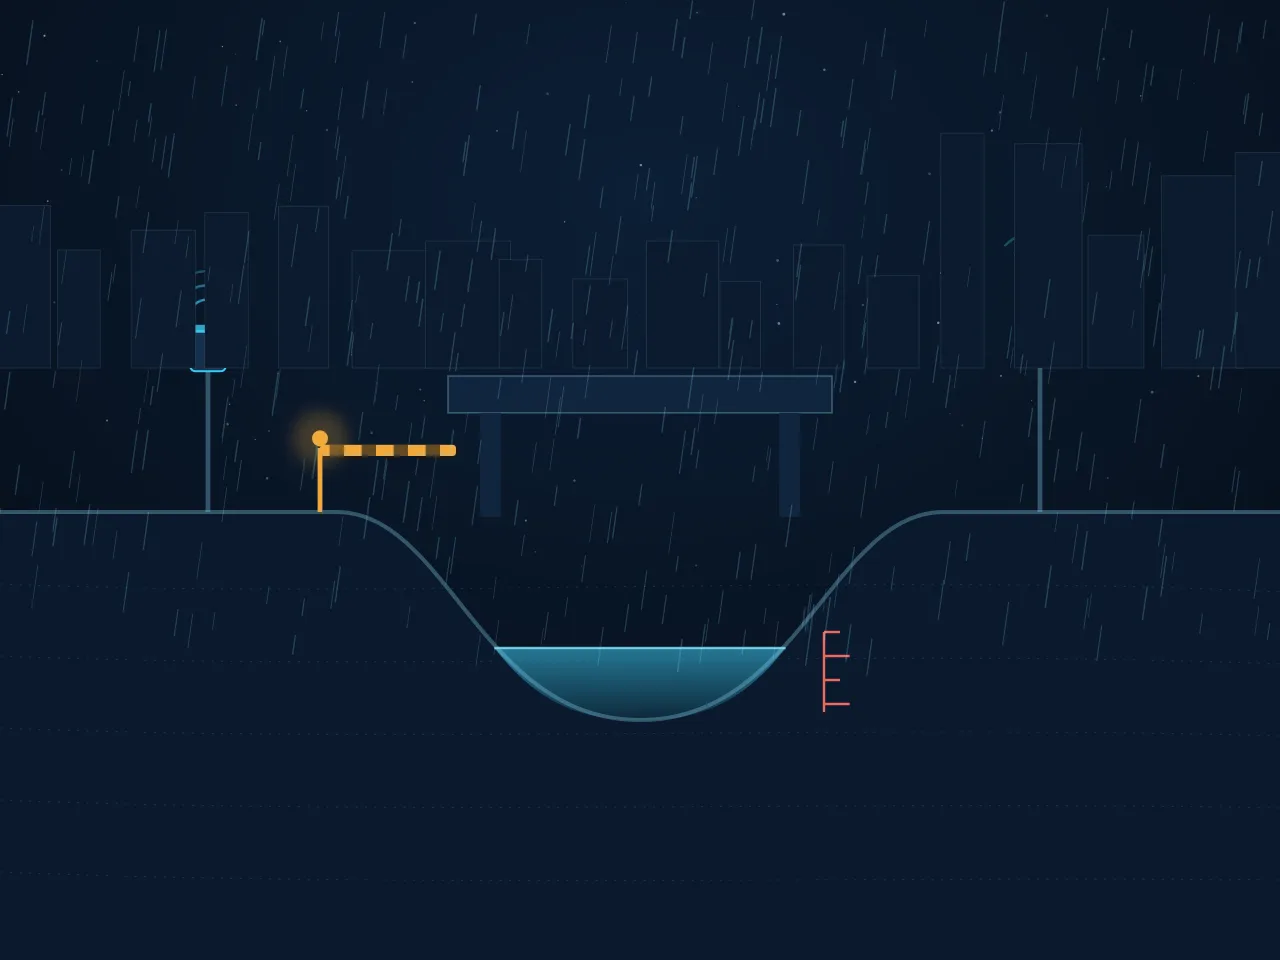
WMO observation guidance recommends placing rain gauges where wind and obstacles have little effect. Buildings and trees can shelter the gauge or change wind flow, making readings too low or too high.
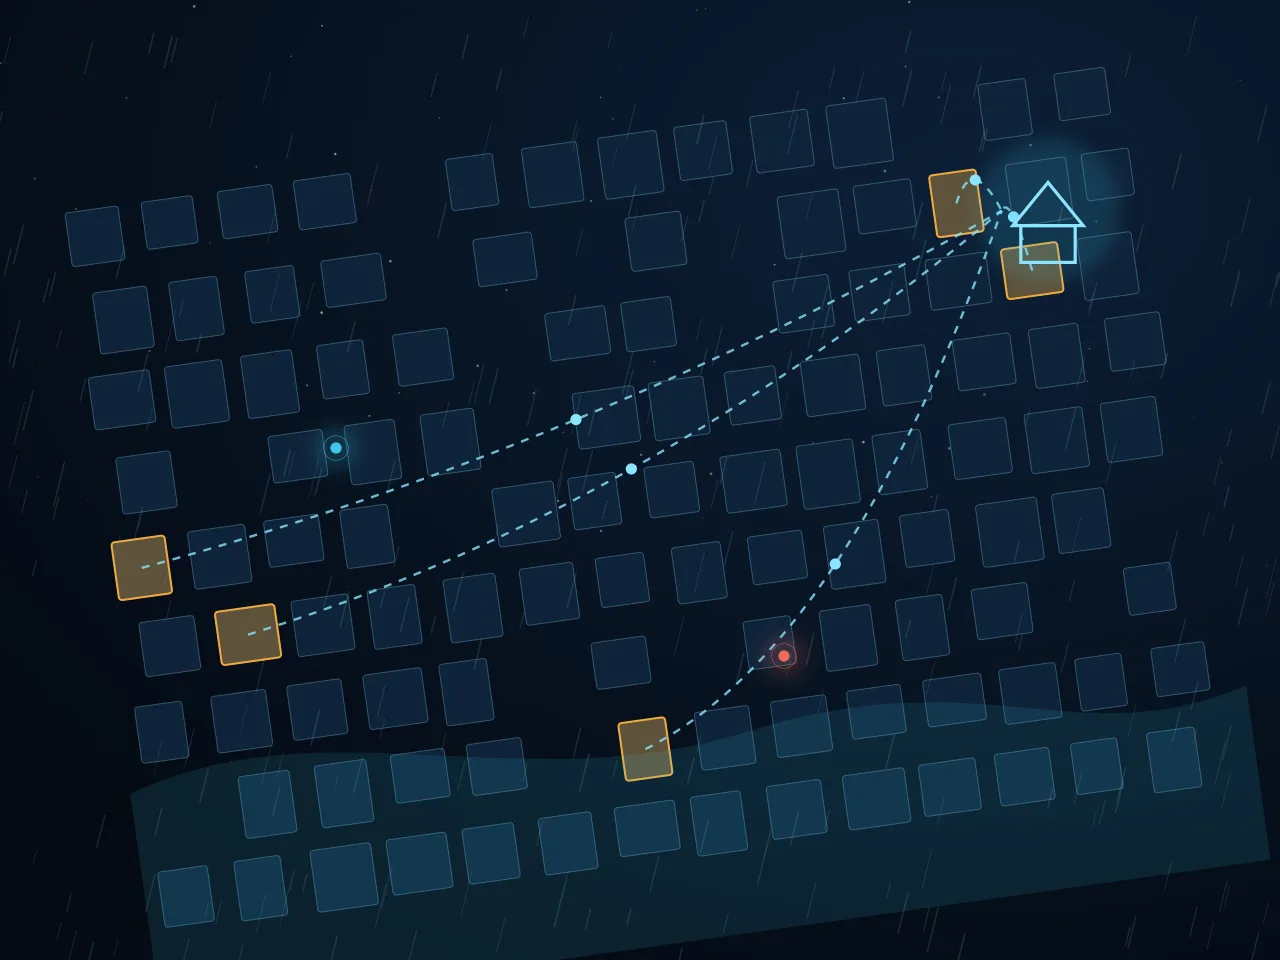
But a dense urban network cannot rely on open fields alone. Among realistic sites such as rooftops and roadside poles, the least-affected ones have to be chosen with data.
Three analysis tools
All three can be used together in a 3D design environment (Rhino and Grasshopper), so climate and geographic information can be layered on a city model.
Ladybug · climate analysis
Visualizes climate conditions from EPW weather data and analyzes sunlight, wind and radiant heat, so solar power and wind effects can be reviewed together.
Meerkat GIS · spatial data
Imports professional GIS formats such as Shapefile (SHP) and links geometry with attribute data such as population and land value, for deeper data-driven urban analysis than Elk.
Elk · 3D city context
Imports roads and buildings from OpenStreetMap (OSM) and generates 3D contours from SRTM terrain data, so a city model for analysis can be built quickly.
How candidate sites are chosen
- 01
Build the city model
Use Elk to bring in the roads, buildings and terrain of the target area in 3D.
- 02
Layer risk and population
Use Meerkat GIS to link flood history, low-lying areas and population to the model, narrowing down where observation is needed.
- 03
Analyze climate conditions
Use Ladybug to analyze sunlight hours, prevailing wind and the effect of surrounding buildings at each candidate.
- 04
Compare and select
Weigh wind effects, solar power, connectivity and access together to choose installation points.
- 05
Correct and connect
After installation, the analyzed wind effects become a basis for correction in data quality control.
Sources
- Ladybug Tools — Ladybug Tools
- EnergyPlus Weather Data (EPW) — U.S. Department of Energy · EnergyPlus
- OpenStreetMap — OpenStreetMap contributors
- Shuttle Radar Topography Mission (SRTM) — NASA Earthdata
- Guide to Instruments and Methods of Observation (WMO-No. 8) — WMO